
India VIX – Calculation and its Interpretation
India Vix stands for India Volatility Index.
Volatility Index
Volatility Index is an estimate of the volatility of the market over the upcoming near term. If the market moves up and down rapidly, the volatility index increases. When the market movement slows down, the volatility index too is expected to be low. Also, it must be noted that the Volatility Index is mean-reverting in nature that means eventually it will revert to the average level.
Calculated based on the order book of the underlying index options, the Volatility Index is denoted as an annualized percentage.
India VIX
India VIX is the volatility index of the Indian stock market, Nifty stocks to be specific. India VIX denotes the perception of the Indian market’s volatility in the near term.
‘VIX’ is a trademark of Chicago Board Options Exchange, Incorporated (CBOE) and Standard & Poor’s has granted a license to NSE, with permission from CBOE, to use it for purposes relating to the India VIX.
Calculation of India VIX
India VIX is calculated based on CBOE’s complex methodology with suitable modifications to the NIFTY options order book.
The formula of India VIX is:

where,
T = Time to expiration | Ki = Strike price of ith out-of-the-money Nifty option | ΔKi = Interval between strike prices-half the distance between the strike on either side of Ki | R = Risk-free interest rate to expiration | Q(Ki) = Midpoint of the bid-ask quote for each option contract with strike Ki |
F = Forward index taken as the latest available price of the NIFTY future contract of the corresponding expiry | Ko = First strike below the forward index level F
It may look complex to beginners and it actually is even for professional traders, investors. One may not need to actually calculate these figures as NSE calculates and provides India VIX value regularly.
What traders and investors need to know is the impact of volatility on option prices and India VIX.
India VIX over the years
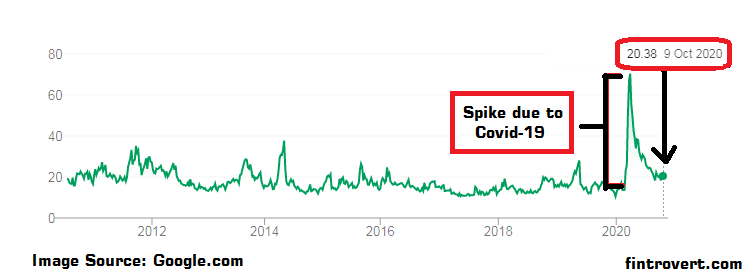
After the outbreak of Covid-19 in India in March 2020, India VIX obviously spiked due to the sudden crash of Nifty. It eventually cooled down once the volatility of the market started contracting.
Options Prices affect India VIX or India VIX affects Options Prices?
As can be seen from the formula, India VIX is calculated from some of the Option prices of Nifty. So it can be said that Nifty Options Prices affect India VIX.
Having said that, the value of India VIX is considered as an indicator by traders and investors to perceive volatility and thus bid accordingly for other constituent stocks in the Market.
India VIX derived from Nifty option prices thus acts as Implied volatility and being easy to interpret also plays a role in representing the overall volatility sentiment of the market.
Interpretation of India VIX with Examples
As mentioned earlier, India VIX value denotes annualized percentage but there is misinterpretation at times among traders, investors and media in understanding VIX when it is directly just considered as a percentage change.
Technically speaking it is a one-standard-deviation (68.3%) price change over a one-year period.
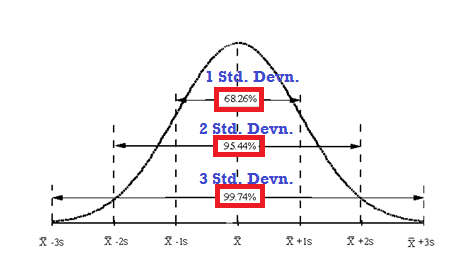
For e.g. If Nifty is at 10,000 (and also considering ‘forward price’ of Nifty to be the same for ease of calculation) and India VIX is 25 it means, if we come back one year from now, there is a 68.26% (1 Std. Devn) probability that Nifty will be trading between +/- 25% of current level i.e it will be trading between 7,500 and 12,500 (and 95.44% (3 Std. Devn) probability to be between +/- 50%: 5,000 and 15,000 and so on.
Note that these are just examples. Individual options Implied volatilities are different from India VIX.
Volatility, India VIX is directly proportional to the square root of time.
So, Daily Volatility = Annual Volatility / Sq. Root(256) …..[Considering 256 trading days in a year]
Weekly Volatility = Annual Volatility / Sq. Root(52) …..[Considering 52 trading weeks in a year]
Thus,
Daily Volatility = Annual Volatility/16
Weekly Volatility = Annual Volatility/7.2
Considering the above example again, if India VIX is 25, then,
Daily Volatility:
There is probability Nifty will be at a value between +/- 25/16 = +/-1.56% (for 1 Std. Devn.) = between 9843.75 and 10,156 on 68.26% days i.e. on every 2 out of 3 days.
It also means, Nifty will be between +/-3.12% ( = 1.56 x 2… for 2 Std. Devn.) = between 9,688 and 10,312 on 95.44% days i.e. on every 19 out of 20 days.
Also Check: Stock Market Timings in India
Weekly Volatility:
There is probability Nifty will be at a value between +/- 25/7.2 = +/-3.47% (for 1 Std. Devn.) = between 9,653 and 10,347 on 68.26% days i.e. on 2 out of 3 weeks.
Thus it can be said that when India VIX is 25 and Nifty at 10,000 (considering the same forward price), a weekly range of around 700 points in Nifty is possible with around two-third of probability.
It also means, Nifty will be between +/-6.94% ( = 3.47 x 2… for 2 Std. Devn.) = between 9,306 and 10,694 on 95.44% weeks i.e. on 19 out of 20 weeks.