How to Read CandleStick Chart
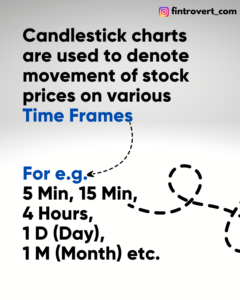
Candlestick charts are used to denote movement of stock prices on various Time Frames.
Example: For e.g. 5 Min, 15 Min, 4 Hours, 1 D (Day), 1 M (Month) etc.
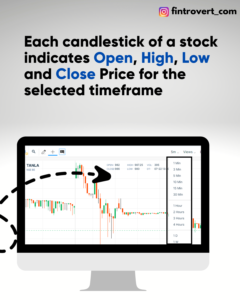
Each candlestick of a stock indicates Open, High, Low and Close Price for the selected timeframe.
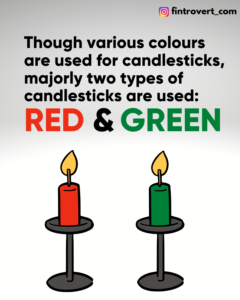
Though various colours are used for candlesticks, majorly two types of candlesticks are used: RED and GREEN
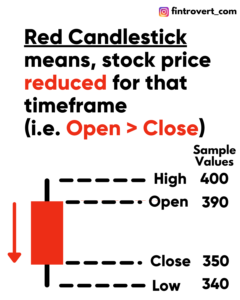
Red Candlestick means, stock price reduced for that timeframe (i.e. Open > Close).
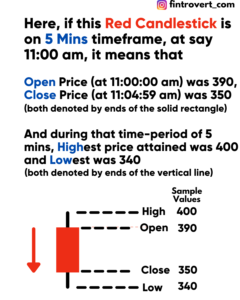
Here, if this Red Candlestick is on 5 Mins timeframe, at say 11:00 am, it means that
Open Price (at 11:00:00 am) was 390,
Close Price (at 11:04:59 am) was 350 (both denoted by ends of the solid rectangle);
And during that time-period of 5 mins, Highest price attained was 400 and Lowest was 340 (both denoted by ends of the vertical line).
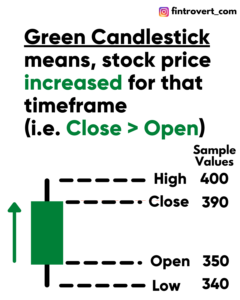
Green Candlestick means, stock price increased for that timeframe (i.e. Close > Open).
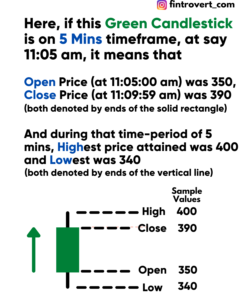
Here, if this Green Candlestick is on 5 Mins timeframe, at say 11:05 am, it means that
Open Price (at 11:05:00 am) was 350,
Close Price (at 11:09:59 am) was 390 (both denoted by ends of the solid rectangle);
And during that time-period of 5 mins, Highest price attained was 400 and Lowest was 340 (both denoted by ends of the vertical line).
This basic information is sufficient to read any candlestick chart. For any queries, comment below.